MORE LISTINGS. SLOWER DEALS. TIGHTER RENTALS. WHERE NYC’S NEGOTIATING POWER IS SHIFTING.
**By | NYC Exclusive Apartments**
**Prepared October 30, 2026**
*September is the latest monthly housing report identified on StreetEasy’s linked Market Data page, published October 15. Late-October economic updates below are labeled separately.*
EXECUTIVE SNAPSHOT
New York’s housing market is presenting different challenges to buyers, sellers, and renters. More homes arrived for sale, but contract activity slowed and marketing times lengthened. Rental availability moved in the opposite direction, tightening across the three boroughs profiled.
**My interpretation: selective negotiating opportunities are emerging for buyers, while renters face a less forgiving supply picture.** Sellers need to demonstrate value through pricing, presentation, and building information.
StreetEasy’s September findings include:
– **New sale listings:** 4,951, up **7.6% year over year**.
– **Sale inventory:** 16,737 homes, down **4.9%**.
– **Homes entering contract:** 1,528, down **5.4%**.
– **Median days on market:** 88, up **14 days**.
– **Median asking rent:** $4,150, up **3.9%**.
– **Rental inventory:** 29,029 homes, down **15.3%**. [StreetEasy Blog]
**The practical message:** a property can face limited direct competition and still struggle to attract an acceptable offer. NYC real estate continues to resist one tidy headline—much like a king-size bed in a studio.
THE SALES SCORECARD
*September 2026. Percentage changes are year over year; DOM changes are measured in days.*
| Metric | NYC | Manhattan | Brooklyn | Queens |
|—|—:|—:|—:|—:|
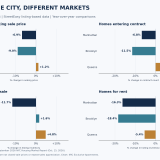
| **Median asking sale price** | **$995,000** | **$1,350,000** | **$1,000,000** | **$698,000** |
| **Asking-price change** | −5.2% | −6.9% | −9.0% | +1.2% |
| **Homes for sale** | 16,737 | 7,957 | 4,363 | 3,326 |
| **Inventory change** | −4.9% | −11.7% | +1.6% | +4.8% |
| **Homes entering contract** | 1,528 | 660 | 415 | 353 |
| **Contract change** | −5.4% | −6.8% | −11.5% | +9.3% |
| **Median days on market** | 88 | 102 | 77 | 78 |
| **DOM change** | +14 | +11 | +16 | +11 |
Source: StreetEasy’s September report. **Asking-price medians are not closed-sale prices or measurements of the same homes’ appreciation.** [StreetEasy Blog]
New Listings and Total Inventory Tell Different Stories
**New listings are arrivals; inventory is the pool of listings available during the reporting period.** Homes also enter contract, sell, or leave the market.
Consequently, more new listings do not automatically mean abundant choices for a buyer seeking a particular neighborhood, layout, ownership type, and monthly budget.
THE RENTAL SCORECARD
*September 2026. Changes are year over year. “pp” means percentage points.*
| Metric | NYC | Manhattan | Brooklyn | Queens |
|— |—: |—: |—: |—: |
| **Median asking rent** | **$4,150** | **$4,995** | **$3,945** | **$3,400** |
| **Rent change** | +3.9% | +8.0% | +3.8% | +4.7% |
| **Homes for rent** | 29,029 | 12,736 | 10,758 | 4,323 |
| **Rental inventory change** | −15.3% | −16.3% | −18.4% | −5.4% |
| **Rentals with price cuts** | 16.0% | 19.8% | 13.6% | 13.7% |
| **Price-cut share change** | −3.9 pp | −4.6 pp | −2.7 pp | −4.4 pp |
| **Rentals offering concessions** | 17.6% | 14.4% | 19.2% | 17.9% |
| **Concession share change** | −1.9 pp | −2.1 pp | −2.0 pp | −0.8 pp |
StreetEasy defines concessions here as **at least one month of free rent**. These price-cut shares concern **rentals**, not homes for sale. Asking rents are not signed-lease rents. [StreetEasy Blog]
For renters and rental owners, compare the actual apartment against available alternatives. A listing with a documented pricing problem deserves a different negotiation approach from a newly listed, competitively priced home.
BOROUGH DEEP-DIVE
MANHATTAN: Scarcity and Slower Decisions Can Coexist
Manhattan’s combination of lower sale inventory, slower contracts, and longer marketing times calls for careful segmentation.
**My interpretation:** buyers should distinguish desirable homes with few comparable alternatives from listings whose price, condition, financing requirements, or carrying costs discourage offers.
**Agent implications:**
– Build the **comparative market analysis, or CMA**, around neighborhood, ownership type, size, condition, floor, outdoor space, and monthly charges.
– Investigate why a listing remains available before recommending a discount.
– For rental searches, prepare application documents and an accurate ownership-versus-rental budget early.
A falling borough asking-price median is not an automatic discount entitlement on a particular apartment.
BROOKLYN: Investigate the Opportunity Behind Longer Marketing Times
Brooklyn’s sales indicators suggest a reason to investigate individual sellers’ flexibility. They do not establish equal negotiating room in every neighborhood or building.
**Agent implications:**
– Screen longer-marketed listings, then inspect the cause: layout, renovation needs, monthly charges, financing issues, or pricing.
– Pair a seller’s presentation refresh with a CMA review when engagement is weak.
– Underwrite investment purchases using verified property-level rent and expenses, including vacancy and repairs.
The purchase market and rental market require separate analyses. **Rental scarcity alone does not establish an attractive investment return.**
QUEENS: A Different Demand Pattern
Queens stands apart in the scorecard, with growth in contracts and asking sale prices.
**My interpretation:** a blanket message that buyers are retreating everywhere would miss meaningful local demand.
**Agent implications:**
– Separate **co-ops, resale condos, and new developments** before comparing values.
– Examine maintenance, financing requirements, and sublet restrictions alongside purchase price.
– Position listings against neighborhood and building-level competition.
A lower purchase price can come with different carrying costs and ownership restrictions. The comparison must extend beyond the listing headline.
BRONX AND STATEN ISLAND: Build a Separate Local Picture
StreetEasy’s published September borough scorecard does not provide separate Bronx or Staten Island tables. This article therefore assigns neither borough inferred prices, contracts, or inventory trends.
A client search in either borough needs its own current local dataset and CMA.
FORWARD SIGNALS
*The following economic updates occurred after the September housing reporting period.*
Mortgage Rates: Recent Relief, With Costs Still Elevated
Freddie Mac’s October 29 survey placed the national 30-year fixed mortgage average at **7.24%**, down from **7.32%** a week earlier. The year-earlier comparison was **6.17%**. Its survey is not an individualized quote for every borrower, jumbo loan, condo, or co-op. [Freddie Mac]
**Watch next:** whether improved financing translates into sustained purchase applications and signed contracts. Better rates can help a budget without guaranteeing an easier property search.
CPI and the Fed: Inflation Still Matters
September national CPI increased **3.7% year over year** and **0.6% month over month, seasonally adjusted**. Core CPI increased **2.6% year over year**. These are national inflation figures, separate from StreetEasy’s NYC asking-rent measures. [2026 M09 Results]
On October 28, the Fed maintained its target range at **3.75%–4.00%** and described inflation as elevated. That short-term policy rate is different from a mortgage rate. [Federal Reserve issues FOMC statement]
**Watch next:** inflation releases, bond-market expectations, and actual lender quotes. Keep the purchase workable without depending on a predicted rate cut or refinance.
MBA Applications: A Rebound With a Weak Annual Comparison
MBA’s October 28 release, covering the week ending October 23, reported:
– **Total applications:** up **3.4%**, seasonally adjusted, from the previous week.
– **Purchase Index:** up **4%**, seasonally adjusted.
– **Unadjusted purchase activity:** still **18% below** a year earlier. [MBA]
**Watch next:** several weeks of improvement rather than treating one rebound as a trend. National applications are not NYC contracts, and they exclude all-cash purchases.
Absorption, Seasonality, and Supply Pipelines
**Absorption:** Track comparable active listings against recent contracts using a consistent geography, property type, and price band. No formal months-of-supply estimate is calculated here: the published monthly counts do not establish a clean, consistently measured stock-to-flow series.
**Seasonality:** Separate year-over-year changes from month-over-month movement. Do not assume autumn automatically produces rental bargains; inspect listing histories and incentive terms.
**Pipeline:** Distinguish announcements, construction, completions, and units actually marketed. For a target building, review DOB NOW/BIS records, sponsor documents, financing eligibility, and delivery evidence. This report does not provide a citywide completion forecast.
PLAYS FOR PROS
*These are practical strategies, not forecasts or StreetEasy recommendations.*
INVESTORS: Underwrite the Building Before the Borough
1. **Build a verified operating model.**
Use Excel or Google Sheets to record achievable rent, taxes, maintenance/common charges, insurance, repairs, vacancy, management, and assessments. Run a base case and a downside case.
2. **Confirm the intended rental use.**
Review governing documents, sublet policies, leases, regulatory status, building financials, and financing with the appropriate professionals. Investigate building issues through official records, then estimate their cost and timing.
3. **Negotiate from documented problems.**
Use OLR or Perchwell listing histories and comparable properties to quantify renovation, condition, or carrying-cost differences. Support the offer with evidence rather than a standard borough-wide discount.
BUYERS: Match the Offer to Actual Competition
1. **Build a focused CMA.**
Start with recent closed comparables, add current competition, and identify pending properties separately. Adjust for condition, ownership type, floor, outdoor space, and monthly charges.
2. **Maintain two shortlists.**
Track scarce, well-priced homes requiring readiness and longer-marketed homes requiring investigation. Use saved searches and brokerage alerts to monitor price and status changes.
3. **Compare financing and purchase terms together.**
Request lender comparisons using the same loan amount, property, points, and lock period. Discuss any closing-cost credit with the lender and attorney, including program limits and contract language.
SELLERS: Measure the Launch and Respond to Evidence
1. **Price against homes buyers can tour.**
Combine a building/neighborhood CMA with current alternatives. Document how condition and carrying costs affect positioning, and set a review date before launch.
2. **Prepare a complete marketing package.**
Use professional photography, a clear floor plan, accurate features and charges, and useful video. Gather transaction documents early and market consistently under fair housing requirements.
3. **Review first-week performance.**
Track views, saves, inquiries, tours, and feedback through listing analytics and a CRM. Diagnose weak exposure, weak conversion, and repeated objections before deciding whether to change presentation or price.
StreetEasy’s separate October 29 study found that the most-saved third of homes during their opening week reached contract in a median **44 days**, compared with **81 days** for the least-saved third among homes sold that year. **That is an association, not proof that increasing saves causes a sale.** [StreetEasy Blog]
RISKS & CAVEATS
– **Asking prices are not appraisals or closed-sale medians.** Listing mix can move a median without every property changing value.
– **Contracts are not closings.** Financing, board review, and transaction conditions still matter.
– **Sales price-cut share is not supplied.** Do not substitute the rental price-cut figures.
– **Concessions are narrowly defined.** Verify base rent, effective rent, lease duration, and renewal implications.
– **DOM is the report’s published median.** It does not predict an individual property’s marketing or closing timeline.
– **Coverage and timing differ.** StreetEasy data, mortgage surveys, CPI, and application indexes describe different populations and periods.
– **Some requested metrics remain unavailable.** The report’s scorecard does not supply rental DOM, full borough new-listing totals, formal absorption, or a quantified completion pipeline.
SOURCES
– [StreetEasy: September 2026 NYC Housing Market Report]
– [StreetEasy Market Data] and [Data Dashboard]
– [StreetEasy: First-Week Views, Saves, and Sale Outcomes]
– [Freddie Mac: October 29 Mortgage Survey]
– [BLS: Consumer Price Index]
– [Federal Reserve: October 28 FOMC Statement]
– [MBA: October 28 Weekly Applications Survey]
—
**Work with a data-driven NYC advisor.**
**Sydney Harewood** — Licensed Real Estate Salesperson, FIND Real Estate
**Call/Text:** 646-535-3819 • **Email:** [[email protected]]
**Site:** [https://www.nycexclusiveapts.com] — *Your Premier Bridge to Manhattan Living and Wealth*
Follow updates on X: @Sydharew
Office: FIND Real Estate, 5 West 37th St, 12th Floor, New York, NY 10018
—
*Information is listing-based and for educational purposes; not legal, tax, or investment advice. Verify building financials and local regulations before transacting.*
We hope you found this information helpful. If you have any other questions or need more details, feel free to contact us.